This blog post is sketching out the basics of a roast profile analysis and introduces the concepts and basic calculations that are part of the exam for the Roasting professional in the SCAE Coffee Diploma System.
A roast profile is a graphs that shows the temperature development during a roast cycle and preferably both bean and air temp is measured and logged. An idealized profile is illustrated here:

During a roast you have different events, and the next illustration plots in these events:

As you can see when the green coffee at room temp is added to a preheated roasters the temperature drops quickly but after some time you would get a turning point where the temperature starts rising rather than falling. After the turning point you have a period of the roast with maximum temperature increment speed and the speed of the roast is in the business often called Rate of Rise (RoR) and the maximum rate of rise is a good thing to log and will be explained in detail later in this post. After a while you get 1st crack and the last event is when the roast ends and the ‘development’ time is time from 1st crack to end of the roast.
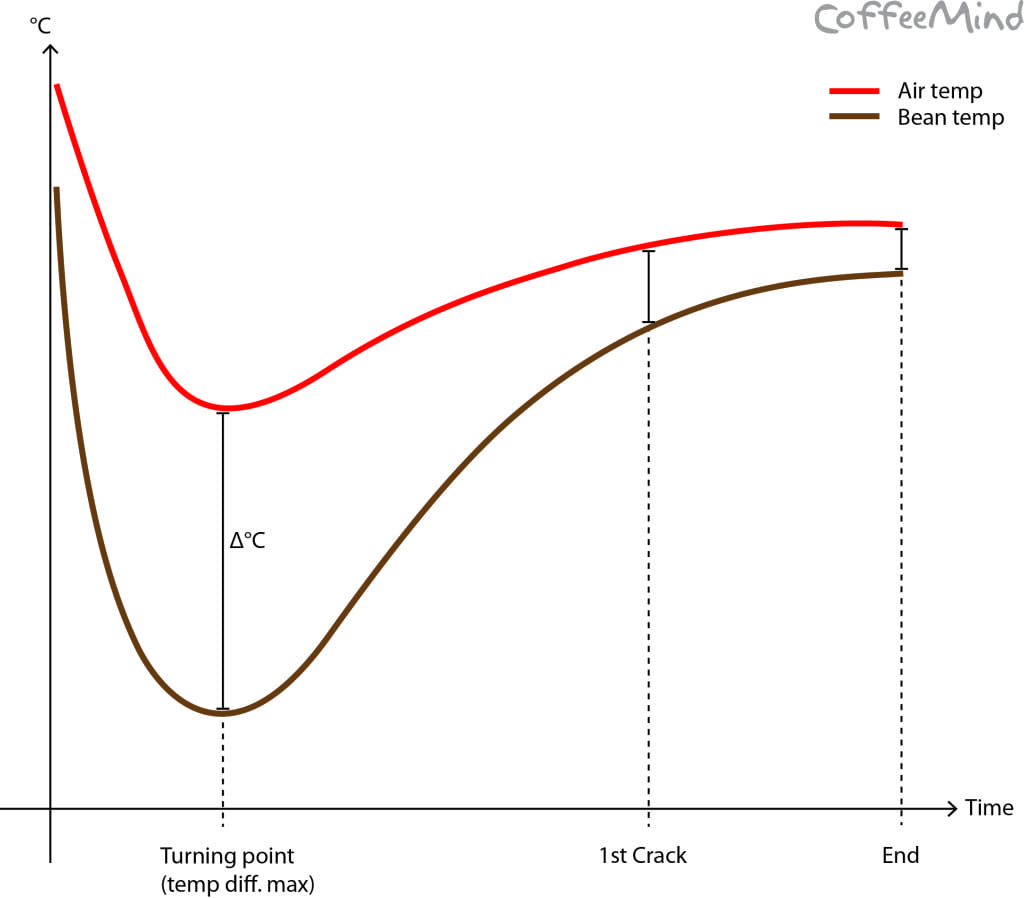
The temperature difference between air and bean is an interesting measure since it gives in indication how much convection drives the roast at any part of the roast process. I recommend to calculate the temperature difference at the turning point, at 1st crack and at end as shown on this below illustration:

Other interesting readings from the graph is the rate of rise as shown below:

The rate of rise is the speed of the roast (degrees pr minute) at any given time at the roast. 3 relevant points at the roast is defined above namely the max RoR, RoR at 1st crack and RoR when the roast finishes.
If you understand everything so far, there is no need to read further, but at the exam for the Roasting Professional Certification calculations are important since it is part of the certification process.
Geometrically a rate is the slope of a tangent at a given point on a curve:

A tangent only touch the curve in one point and it is exactly in this point that the tangent says something interesting about the slope namely how quickly the curve ‘changes’ in this point. So the tangent represents the speed of the curve in this particular point so we would like to calculate the inclination of the tangent because the inclination of the tangent equals the inclination of the curve in the particular point. So for a roast profile the tangent at any given point exposes the speed of the roast at this given point.
So measure the slope of a tangent you can just choose a random range of the tangent like in this example:

On the above illustration we have °C on the vertical axis and time on the horizontal axis just like on a roast profile. Just as an example the slopes is calculated based on how much the speed of temperature rise is in 3 min, and as you can se the specific tangent will rise 42°C during 3 minutes which will give you 14 degrees per minute which is the Rate of Rise of the curve (the circle in this example) in exactly the point where the tangent touch the curve.
If we choose to calculate the RoR at another point of the curve I could be a little later in the process like this:

Here you can see, that the slope of the curve is different and the inclination of the tangent in the point is less steep. Here the time period is chosen to be 4 minutes and during the 4 minutes the temperature rises with 22°C giving a Rate of Rise of 22°C / 4 minutes = 5,5° pr minute. I prefer to always look at the inclination of the tangent in a 4 minutes period because I find it easy to divide the corresponding temperature range by 4 in my head.
But let us look at an example that is relevant to the RoR of a roast profile:

As with the other tangents we would like to know how many °C the temperature changes during the 4 minutes of the tangent that represents the inclination of the curve in the one point where the tangent touch the curve. The challenge here is that the tangent is completely horizontal so there is not change in temperature which means that the temperature difference is = 0! So if we divide 0 with 4 we still have 0. So the RoR of the curve in the point where the tangent touch the curve is 0. In other words: the temperature is not going up anymore so the speed of the roast has stalled which is announced by the RoR by taking on the value of 0.
There is one last state of the RoR worth a mention and that is when the slope of the tangent is negative:

When the curve starts to go down after having stalled the RoR becomes negative because when you consider a change you always calculates the change by subtracting the initial state from the resulting state and if the process has gone in the reverse direction you subtract a bigger number from a smaller number and the result is negative (see the blogpost about change for a deeper explanation) so here it is -22°C/4min = -5,5°C/min. A negative RoR is something you don’t want in your roast profile in general yet for the last few seconds in the roast some coffees would work with a very low RoR, a stalling RoR (=0) and only few profiles would you ever find with a negative RoR in the end of the roast!
So to conclude this post the following is an illustration of all the main points of a roast profile:

Free printable roast log: Profile-log