This article basically gives you a tool to answer these two crucial questions concerning you way of handling colour measurement equipment:
- Which grind size gives me the best results?
- How many replicates of each sample is ‘enough’?
I recently had the pleasure to roast coffees for a university project where consistency in the roast was key to minimize variation in the overall research setup and since I just got my new colour measurement apparatus I did not know the answer to the above questions.
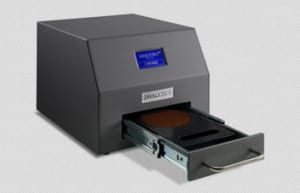
My new colour measurement apparatus is the JAVALYTICS™ JAV-RDA-D that suits my needs well in my lab. One handy thing about this is that they did not invent a new arbitrary measurement scale but has made a great effort to be able to work with different scales and quite versatile in its ability to synchronize with other brands of measurement standards.
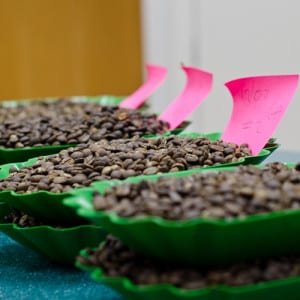
One of the most important aspects to standardize was the colour of the roasted beans. They happened to be extremely dry (5%) moisture and extremely non-uniform in terms of size and even moisture so colour measurement of the final ground product was important to establish some consistency in an otherwise quite diverse setup! And to determine how precisely I was working with a diverse product I needed to do some calculations.
The Javalytics technology made a great effort to be able to work with different roast degree measurement scales and quite versatile in its ability to synchronize with other brands of measurement standards.
The technology sends light to a ground sample of the coffee and measures how much is reflected. So the number gets SMALLER when the sample is DARKER as less light is reflected on a dark roast and vice versa for a light roast. If light is not reflected into the sensor it could be that
- it is absorbed by the darkness of the sample or
- it can be reflected but not perpendicular to the surface and then it is lost on the sides inside the measurement chamber
You would like to avoid (2) as this is an error and does not reflect the darkness of the sample but error in the setup. If the grounds are to fine you get a ‘hilly terrain’ on the surface on the sample when you try to smoothen it out and the hill sides sends the light into category (2). On the other extreme you have bit grounds that also reflects light ‘non-perpendicular’ that also looses a lot of light in category (2).
So the best grind size is in between the two extremes. But practically where?
To answer this question before starting to roast the samples I choose a coffee that is roasted as a filter coffee (around 72 on the Agtron Gourmet scale as you can see in the below spread sheet) and performed different samples with different grind size. You can see the result in this spread sheet:
(if you have problems with the functions it might be because I have a danish MS excel where they for ridiculous reasons have translated the functions to danish! If you have problems you might be able to get help to translate the name of the danish functions to english here)
So I measured 5 replicates of 4 different grind sizes but the document is prepared to do 10 different grind sizes and 8 measures per grind size. You can just add your own values in the spreadsheet and get the results immediately.
I have the most important value on the left that is generated by information on the right hand side in the document so let me explain it starting from the right side. ‘Measure 1 … Measure 8′ are the individual measures that you do on each grind size (replicates pr grind size) and you can choose the number of measures as you want but I would recommend more than 3 to get more precise results. The ‘number of samples’ column is just a trivial counting of the number of measures you do on each grind size that is needed by the function that calculates the 95% confidence interval (explained in a minute..). The first numbers to calculate is the average reading of the colour measurements for the grind size and the standard deviation. The standard deviation indicates how big the variation is at each grind size and as we are looking for the grind size that gives the most accurate (less variation) results and from the numbers and the graph we can conclude that we get the most accurate readings on grind size 2. But we still don’t know how accurate it is.
In itself the standard deviation does not lend itself to useful practical interpretation other than comparing variation between sample pools so this is where the 95% confidence interval comes in. It tells you in which interval you based on the given samples with 95% certainty (which is interpreted as optimal certainty) would estimate the ‘real value’ of the colour of the coffee. The 95% confidence interval depends on the variation and the numbers of replicates and it gets more precise as the variation gets smaller and/or if you take more replicates. So with the given variation we would like to know how many replicates we need in order to get a satisfying precision (narrow enough 95% confidence interval)
So to determin the width of the 95% confidence interval we have to calculate the lower end (column C) and the upper (column D) end and subtract the lower from the upper which gives us the width (column B).
As you can see I did 5 replicates per grind size to have enough data and clearly the 5 replicates gives sufficiently narrow confidence intervals (sensory relevant differences is in the area of 2-3 on the Agtron Gourmet scale) but would less than 5 replicates be enough? To test this I tried to include only 3 replicates and that gave me 95% confidence interval size of the different grind sizes 1, 2, 3, 4 respectively 1.6, 1.2, 2.6, 2.8 which is narrow enough at least for grind #2 so 3 replicates is more than enough (it seems that often just 1 measurement would work at this level of variance). In the lower left graph I have plottet the 95% of respectively 5 and 3 replicates which show the tendency that the confidence interval is always more precise (narrower) with more replicates.
The diagram in the lower right plots the 95% confidence interval around the average value so here you can see how the estimated ‘real value’ of the roast colour. Here you can see that the measurement method tends to estimate the value of the roast degree lighter and lighter the more coarse you grind. I interpret this as the more coarse you grind the more is lost due to not-perpendicular reflection and hence more is lost to the sides in the measurement chamber (wonder if this could be compensated if the sides was constructed as a mirror). At very fine grinds the variation is bigger due to the not smooth surface but it is still measured as a darker average value because much more is absorbed by the sample itself. I don’t know if these interpretations are correct so please challenge me 🙂
The above variation analysis is based on a standard filter coffee roast and not the actual samples that I needed to do. I trusted that the optimum grind size also goes for my coffee samples but I’m not sure the variation is the same on my samples as on the standard roasted filter coffee. My challenge was that my samples was dehulled in a german rice polishing factory because the university had parchment rather than green beans shipped to Denmark so we had to be creative to get it dehulled. They did a great job but there was significantly more silverskin on the beans and as I chose to roast light to expose the differences between the samples more, I struggled with a lot of silverskin in the roasted and ground samples and that added a lot to the variation on the colour measurements. To be sure 3 replicates was still enough (remember that the precision ie the width of the 95% confidence interval depends on number of replicates AND the variation on the reading and the latter depends on the evenness of the roast and the silver skin gave a lot of variation because they are much lighter than the roasted coffee and are scattered amongst the much darker grounds which is very visible on the surface). It turned out that with 3 replicates even in a system with much more variation 3 replicates gave a width of the 95% confidence interval between 0.6 to 2.4 and even the latter is good enough I think.